
Microsoft Clarity is a free analytics tool for “customer journeys” that provides statistics on website usage, session recordings, and heat maps. It’s not really comparable to Google Analytics (or other analytics platforms). But it’s robust, easy to use, and has some interesting features.
What is Microsoft Clarity?
Clarity records information about the users who visit your website and how they behave. It summarizes this information in the form of dashboards and allows you to examine and highlight interesting segments and behaviors.

MS Clarity provides basic information about sessions, interactions, and engagement, and breaks down users by device type, country, and other dimensions. For all of these views, you can examine heatmaps and session recordings. These recordings can help you better understand your users and the issues they face. You can use these insights to improve your website. For more information on MS Clarity, keep reading to learn about Clarity’s highlights and features.
I’d like to request a no-obligation quote for MS Clarity via Oplayo tracking
Key Features and Reports
Custom Dashboard and Metrics
As you’d expect from an analytics tool, Clarity offers a comprehensive overview in the form of a dashboard. It includes all the standard metrics you’d expect: number of sessions, total users, details on page views, and similar data. Surprisingly, the dashboard is missing some of the metrics you’d expect to find in a tool like this. There’s no “Engaged Sessions / Bounce Rate,” no “Conversion Rate,” and none of the tables you might be used to seeing in tools like Google Analytics or Oplayo’s performance dashboards. Additionally, you can’t compare performance across multiple date ranges or segments.

Here is a short list of metrics for your reference:
- Sessions
- Pages per session
- Scroll depth
- Popular pages
- Referrals
- Breakdown by device
- Breakdown by operating system
- Breakdown by browser
- Breakdown by Country
In addition to the usual metrics, MS Clarity aims to provide some insightful findings. In particular, it tries to identify when users encounter friction:
- Dead clicks—the user clicked on a page without triggering any action.
- Rage clicks—the user rapidly clicked on the same small area.
- Excessive scrolling—the user scrolls through a page more than expected.
- Quick backs—the user navigates to a page and then quickly returns to the previous page.
- JavaScript errors—the percentage of sessions that exhibit JavaScript errors. This occurs in the single-digit percentage range and may also be due to user settings.
Specific reports like “Rage clicks” and “Excessive scrolling” show which users were confused or frustrated. These reports are a good way to find out where your website is letting your users down. Fixing these issues can be a great way to improve engagement, lower the bounce rate, and increase the conversion rate.
Session Recording
One of Clarity’s major attractions is that all sessions are recorded. Clarity logs the mouse movements, scrolling, and clicks of every website visitor. These can be viewed and replayed at any time in the future. The official Clarity video below shows what this looks like in action:
The click maps are divided into desktop, tablet, and mobile versions. This allows you to analyze user behavior by device category. The functionality is a bit basic, but a future update promises more options. We’re also expecting the introduction of scroll maps. These visualize the content users see as they scroll down the page, rather than where they click. This is a different type of data that can be very useful for understanding how users navigate.


Filtering and Custom Tags
To gain useful insights, you can use filters to view data based on specific criteria. For example, you could view session recordings where users filled out a form, or heatmaps of pages where users seem to be frustrated. Combining multiple filters can be a great way to analyze user behavior and solve problems.

Filtering really becomes powerful when you use custom tags. With just a few clicks, you can filter for users who are relevant to you at the session or page level. With a little code, you can send additional information (JavaScript triggers) to Clarity via Google Tag Manager. This information can relate to the page the user is on, the user themselves, the weather, or just about anything else. Once you’ve fired these tags, you can filter your reports to view metrics, session recordings, and heatmaps for sessions and pages where they were fired. A good use case for custom tags is tracking “conversion events” on your website, such as when users make a purchase, create an account, or fill out a form. Less obvious but equally useful filters include tracking whether a user is logged in or what type of page they’re viewing. With this tracking, you can filter your dashboards and reports to see how specific users behaved. Unfortunately, there’s no way to compare filtered data (either with all data or with other filtered data). This means, for example, that you can’t compare the “conversion rate” across different custom tags. You can find more information on how custom tags work, along with sample code, in the Clarity documentation under “Filters.”
What Clarity Isn’t...
It’s clear that Clarity isn’t a comprehensive all-in-one analytics platform. But that’s not a bad thing. From our perspective, it even seems to be a deliberate design choice. It doesn’t try to be everything. It aims to be a session recording tool, a heat mapping tool, and a tool for gaining an overview of user behavior. And this focus helps it do a good job. Because of these limitations, you should think twice before getting rid of all your other tracking tools. Here’s why:
It’s no substitute for Google Analytics
It’s clear that, despite some interesting metrics and reports, Clarity isn’t comprehensive enough to serve as your primary analytics tool. This is especially true if you have a complex website with multiple goals, active marketing campaigns, and many moving parts. But you can use both tools side by side. You can even connect them with just a few clicks. Once activated, MS Clarity passes information to Google Analytics. This lets you see which Clarity recordings are linked to one of your Google Analytics sessions. This way, you get the best of both platforms. Ideally, the setup should always be done via Google Tag Manager!
I’d like to request a no-obligation quote for MS Clarity via Oplayo tracking

Most numbers, images, form fields, and other elements are automatically hidden in all recordings and heatmaps. This means it’s very unlikely that you’ll accidentally save someone’s address or credit card information. That’s a good thing, because currently there’s no way to disable this tracking or delete individual recordings without deleting your entire account. If certain content areas are hidden that you believe shouldn’t be displayed, you can control what MS Clarity hides or shows by adding HTML attributes to those elements. You can find more detailed information about this on the help page. Clarity has certainly made an effort to be privacy-conscious, even though it stores data and videos from individual user sessions.
If you have concerns about how MS Clarity collects, stores, or hides data, you should definitely read Clarity’s privacy FAQs. Depending on the structure of your own website, tracking practices, users, and local laws, you should also seek legal advice.
It’s Open Source
MS Clarity is a fairly new product, and there’s certainly still work to be done before it’s ready for widespread or commercial use. At the time this article was written and revised, some features are still missing, there are indications of an upcoming release, and the documentation is only partially available. But MS Clarity—or at least the technology on which it is based—is open source. You can view (and contribute to!) the source code at github.com/microsoft/clarity.
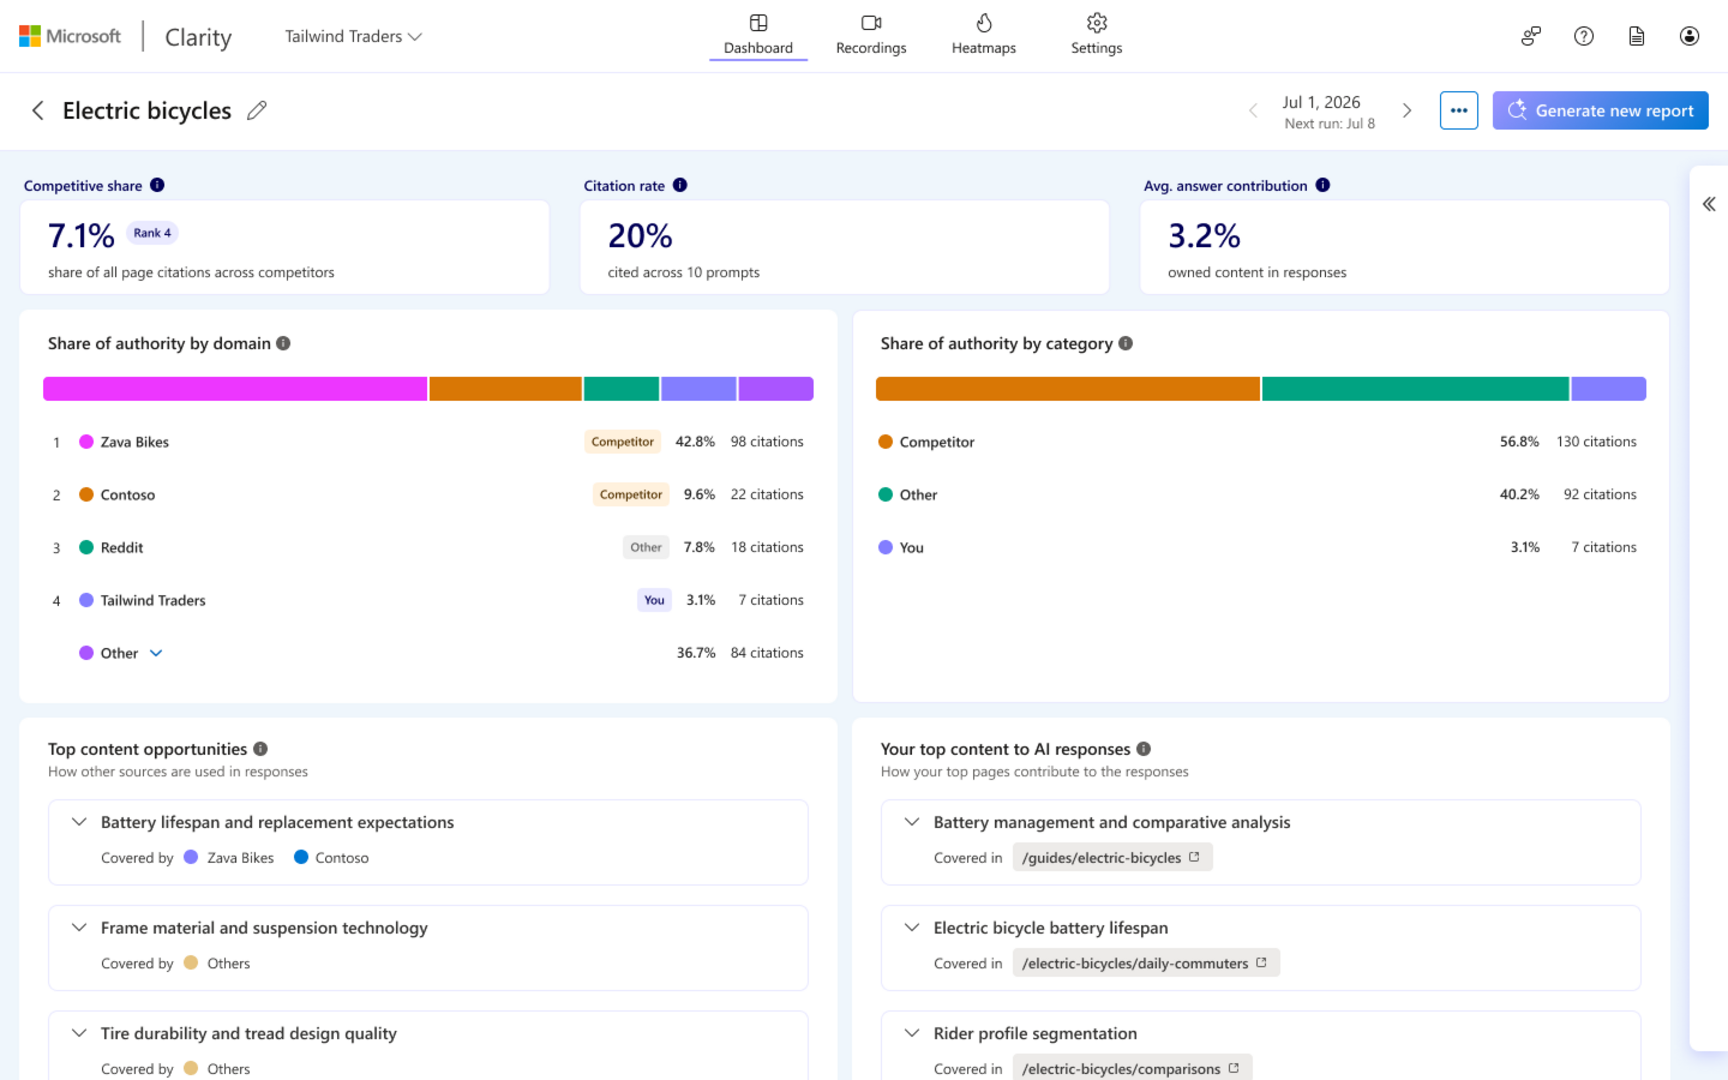
NEW: “Topic Insights” in Microsoft Clarity: How AI Responses Use Your Content
AI-powered search engines and assistants are changing the way people find information, research products, and make purchasing decisions.
Instead of clicking through a list of links, users now receive direct answers based on content from across the internet. Your content may influence these answers, but most AI chat systems don’t provide a clear indication of when, where, or how this happens.
This is a growing area where customers shop and discover content and products today. Traffic generated via AI converts three times more often than traffic from other channels, so optimizing for this channel is crucial.
In early 2026, “Citations” were introduced in Microsoft Clarity. This feature allows you to see which base queries AI systems use to retrieve and reference your content when generating responses.
This was already a major step forward: teams could now see whether their content was appearing in AI responses at all. But this transparency quickly raised deeper questions: Which topics contribute to competitors being cited? Where are you missing opportunities? What content should you create next?
“Topic Insights” answers these questions by going beyond mere transparency to provide actionable recommendations. This latest AI transparency feature from Clarity helps teams understand how they contribute to AI-generated responses, how they stack up against the competition, and where opportunities lie.
"Topic Insights" expands on "Citations" by providing actionable recommendations and helps you identify content gaps, strengthen your authority, and improve your visibility in the field of AI.
For each topic, you’ll receive the following insights:
- Your visibility: How often your domain is cited in AI responses and what your overall share of authority is across all citations.
- Your influence: To what extent an AI response is supported by your content, which shows whether you’re a key contributor.
- Your competition: Which domains are cited alongside yours, how frequently they appear, in which areas they outperform you, and which opportunities are most likely to help you close this gap.
- Your Opportunities: Specific gaps and prioritized actions to improve coverage, strengthen authority, or optimize existing content.
Create your own topics and prompts, and define competitors based on the questions, products, and competitive landscape that matter most to your business. This ensures that visibility and influence are measured where they have the greatest impact.
Turning Insights into Action
Since teams have been working with AI Visibility Insights, they’ve uncovered demand patterns that were not detectable using traditional analytics methods.
Imagine you’re a running shoe brand. You might assume that your visibility comes from brand searches or product pages. Instead, you’ll find that AI frequently mentions competitors when users ask questions like “What are the best running shoes for marathon training?” or “How long do running shoes last?” While your brand comes up in conversations about speed and performance, you’re rarely mentioned in relation to durability, injury prevention, or recommendations for when to replace your shoes.
This insight changes your investment decisions. Instead of creating more content about the same product, you might decide to create a guide on the durability of running shoes, answer frequently asked questions about the right time to replace running shoes, publish resources on training and injury prevention, or strengthen your content in areas where competitors are regularly mentioned but you are not.
Instead of just optimizing for well-known search terms, teams can now identify where AI-driven demand is emerging and what content is needed to meet it.
How It Works
Topic Insights analyzes how AI systems respond to real user questions about your most important topics. Here’s how it works:
- It uses representative prompts that you define and that reflect how users interact with AI systems.
- The AI-generated responses are evaluated to identify the cited domains and pages.
- It measures the extent to which each source contributes to the final response.
- The results are aggregated at the topic level to uncover patterns.
This creates a consistent, scalable picture of AI visibility without having to rely on isolated prompts or sporadic queries.
Getting Started
“Topic Insights” in Microsoft Clarity helps you understand this shift by making AI visibility measurable, comparable, and actionable. By establishing a baseline today, you can better assess where you stand, track progress over time, and measure the impact of content and optimization efforts as AI-driven search continues to grow.
Whether you’re preparing for a major campaign, a product launch, or the holiday season—you can track how your visibility is changing and where new opportunities are emerging.
And unlike many other AI visibility solutions that offer such insights only in paid plans, “Topic Insights” in Microsoft Clarity is available to all users.
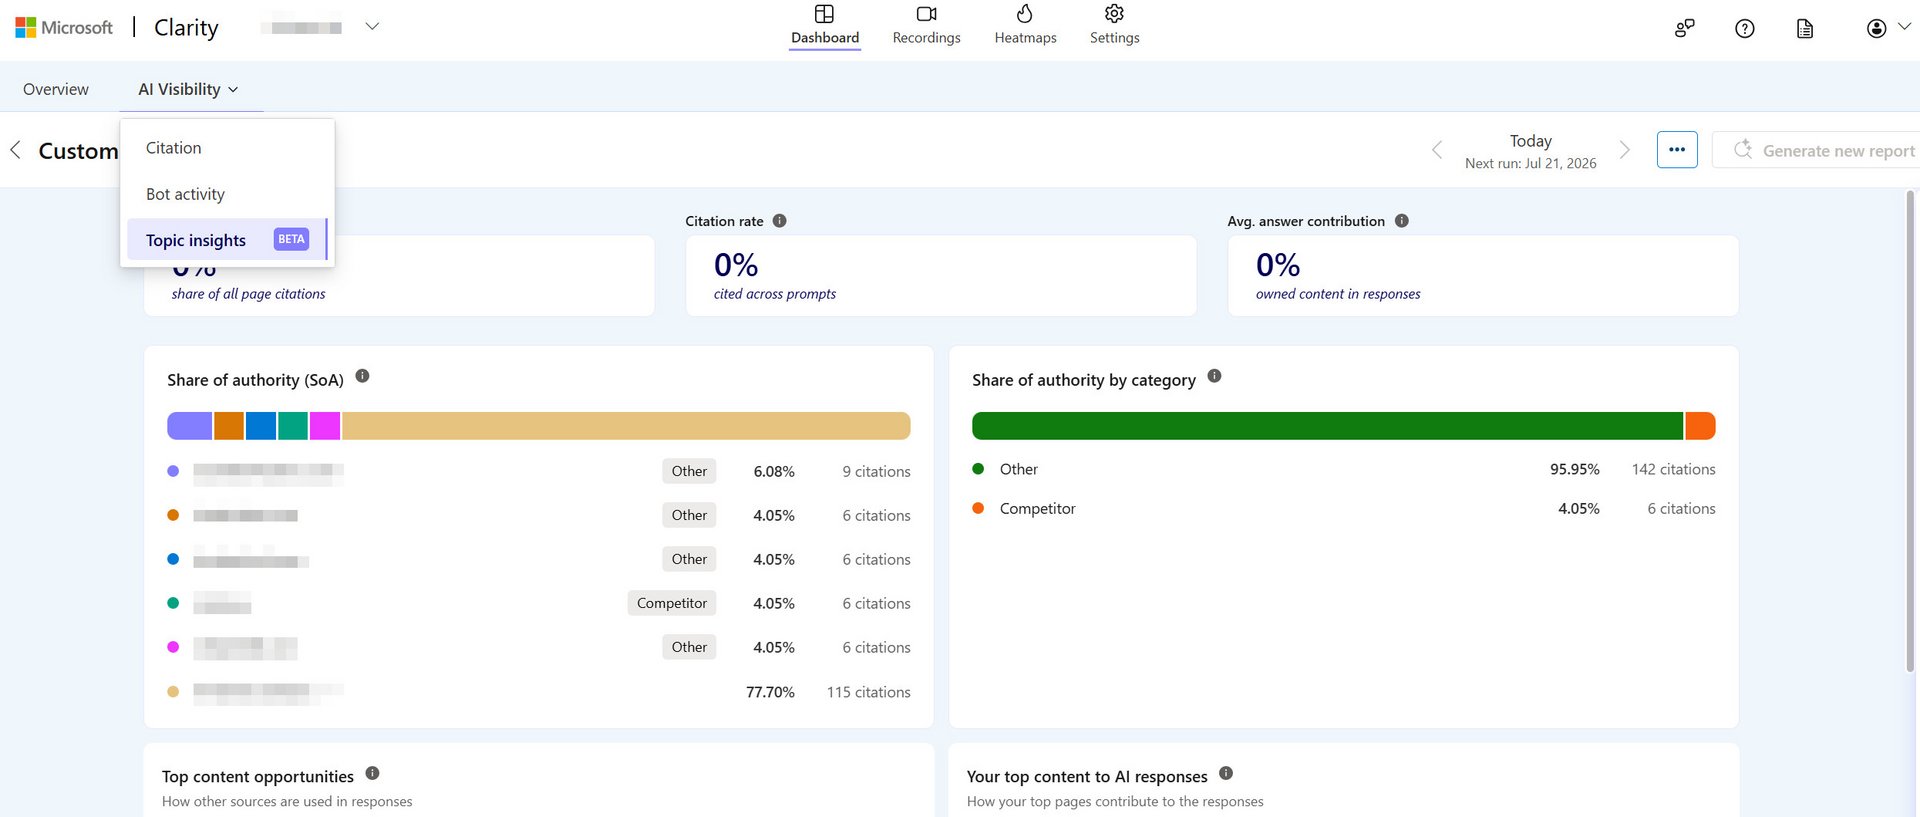
You’ll find “Topic Insights” in Clarity under the “AI Visibility” dashboard, where it helps you identify what needs improvement, what you should focus on, and how to close gaps in your content performance.
In our experience, the tool is significantly weaker in this regard than Sistrix or, for example, Peec.ai.
If you haven’t used AI Visibility in Clarity yet, start by creating a project and verifying your domain to enable “Citations.” Once you’ve enabled “Citations,” simply navigate to “AI Visibility” in the menu and open “Topic Insights.”